6.9.3. Reports 2 - Workflow
# Overview
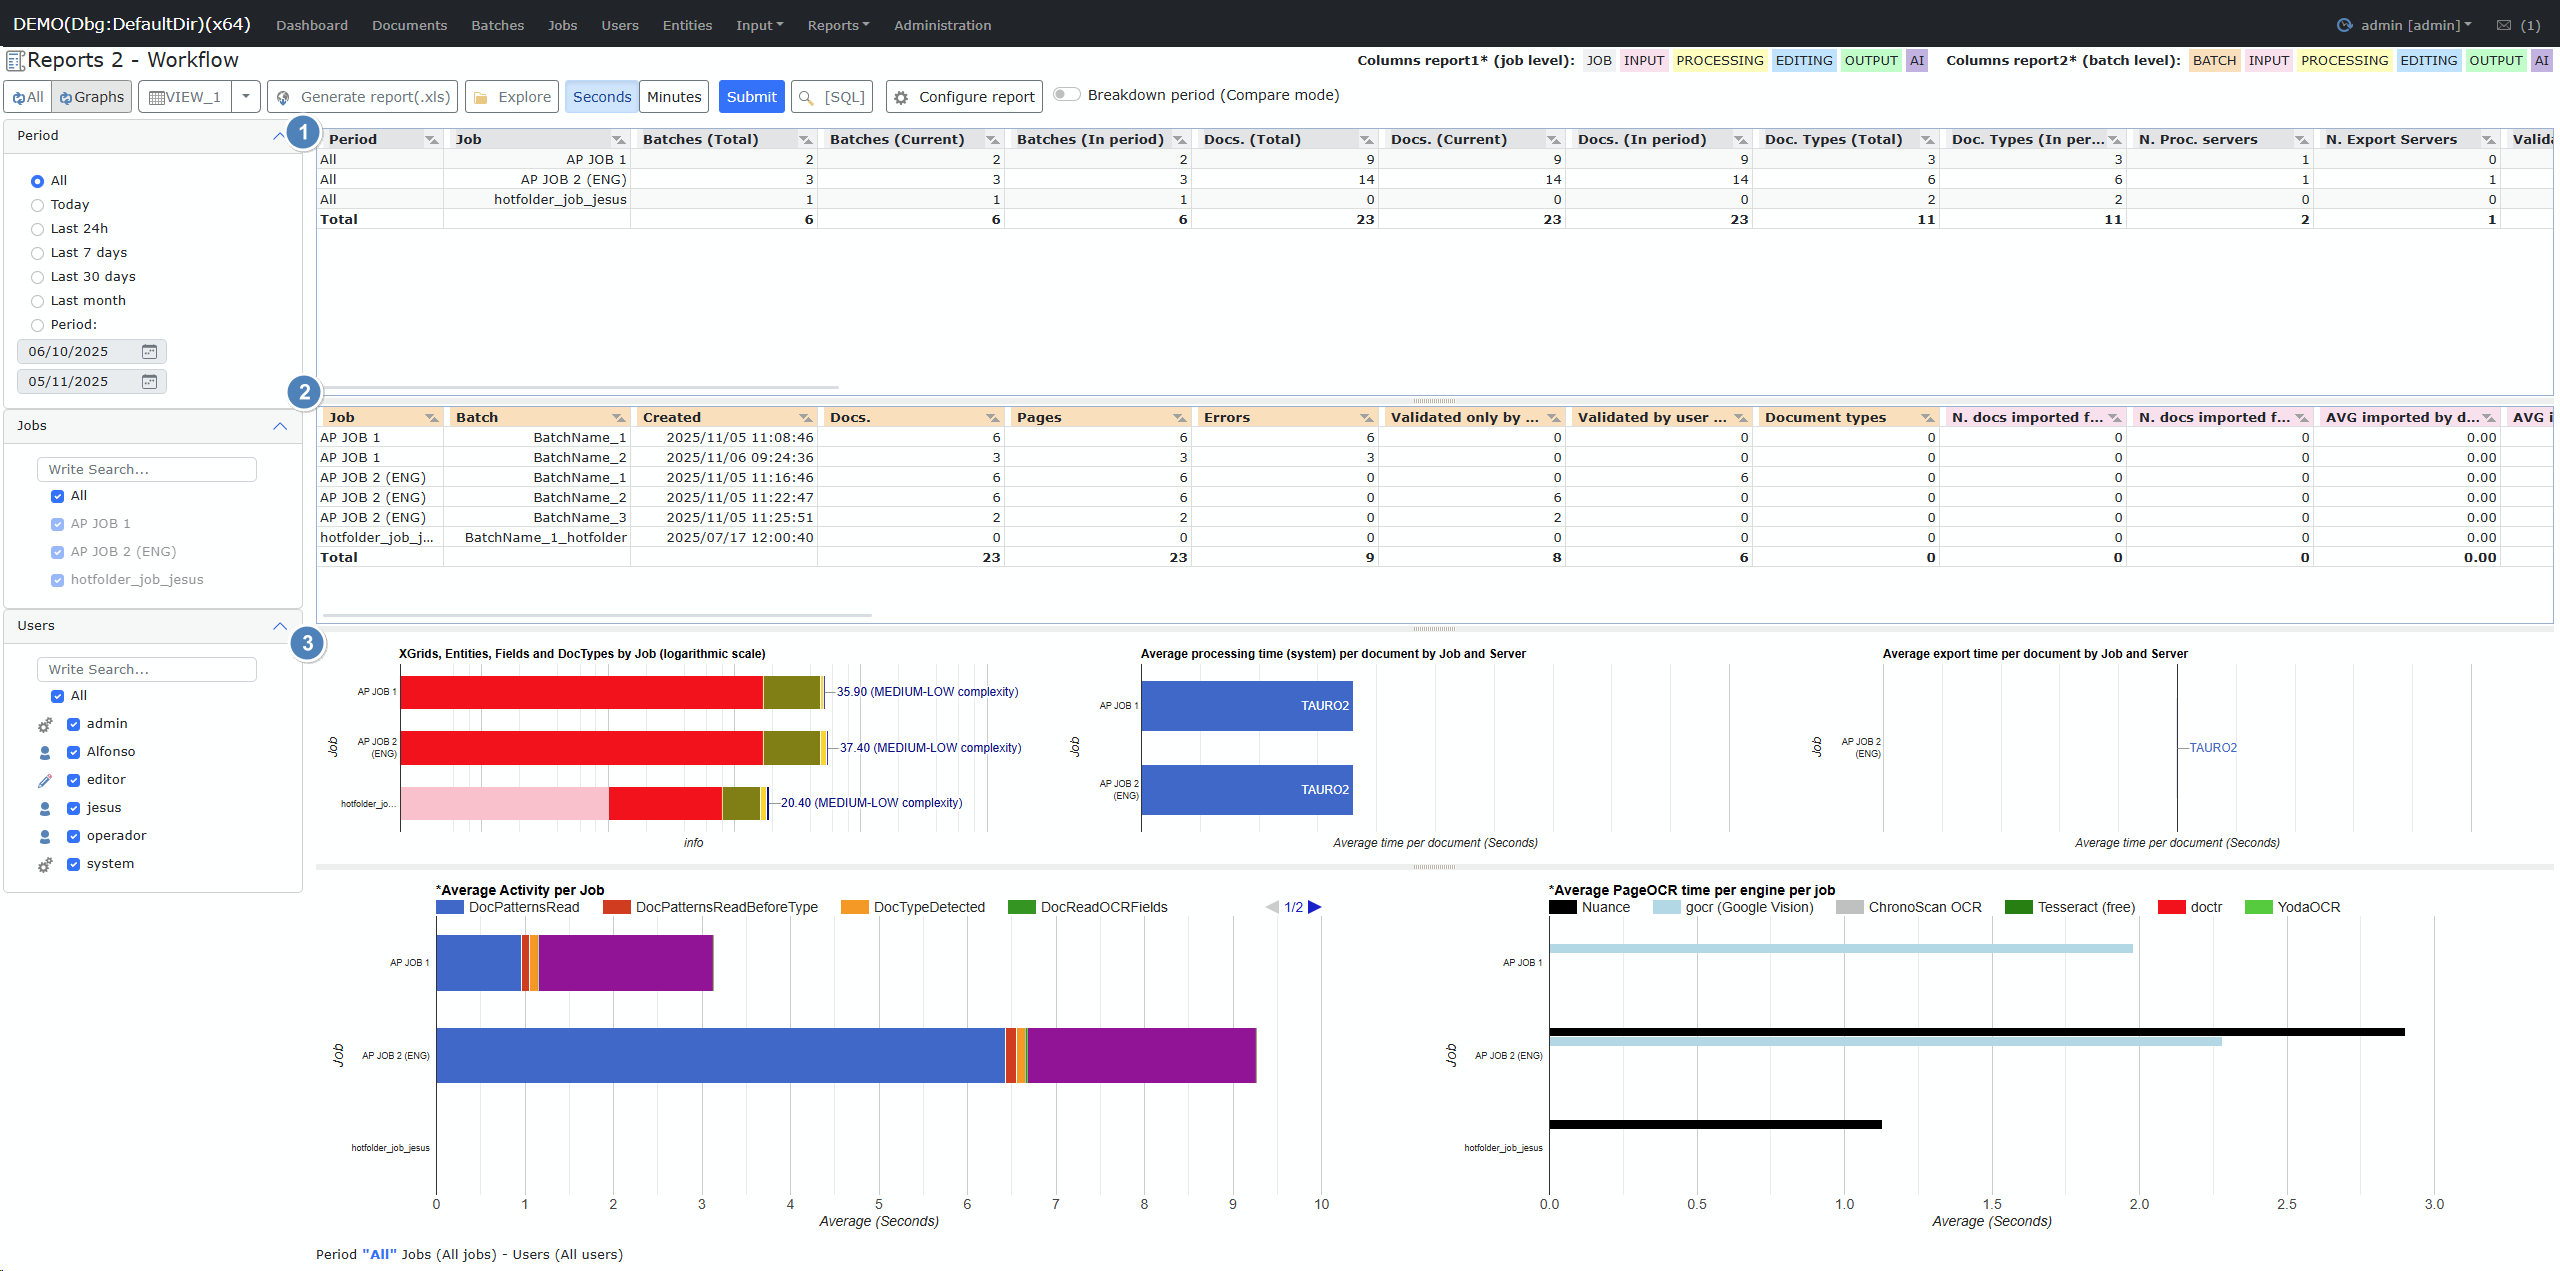
This report provides key workflow metrics captured during various stages of processing for jobs and batches in ChronoScan Enterprise. Two primary report views are available:
-
Job-Level Report: Aggregates metrics per job.
-
Batch-Level Report: Aggregates metrics per batch, available when selecting a specific job in the job-level report.
Configurable columns are visually highlighted to differentiate stage/type of metric (e.g., Input, Processing, Editing, Output, AI).
Job-Level Report
Description:
Shows summarized metrics for each job, with columns reflecting counts, durations, and statistical aggregates for all workflow stages.
Columns:
|
Field
|
Description
|
|
Period
|
Reporting date range
|
|
Job
|
Name of the job/project
|
|
Batches (Total)
|
Total number of batches
|
|
Batches (Current)
|
Number of current batches
|
|
Batches (In period)
|
Number of batches during the selected period
|
|
Docs. (Total)
|
Total number of documents
|
|
Docs. (Current)
|
Number of current documents
|
|
Docs. (In period)
|
Number of documents in the selected period
|
|
Doc. Types (Total)
|
Total count of document types
|
|
Doc. Types (In period)
|
Document types added in the selected period
|
|
N. Proc. servers
|
Number of processing servers
|
|
N. Export servers
|
Number of export servers
|
|
Validated only by system
|
Documents validated solely by the system
|
|
Validated by user and system
|
Documents validated by both user and system
|
|
№ docs. imported from Hotfolder
|
Documents imported via Hotfolder
|
|
№ docs. imported from IMAP
|
Documents imported via IMAP
|
|
AVG imported/docs Hotfolder/IMAP
|
Average files imported per document via Hotfolder/IMAP
|
|
AVG imported/pages Hotfolder/IMAP
|
Average pages imported per document via Hotfolder/IMAP
|
|
№ docs. processed by system
|
System-processed document count
|
|
№ times processed
|
Total document processing runs
|
|
Total processing time (system)
|
Aggregate processing time (system)
|
|
Avg./doc. processed by system
|
Average system processing time per document
|
|
Total reprocessing time (user)
|
Aggregate user reprocessing time
|
|
Avg./doc. reprocessed by user
|
Average user reprocessing time per document
|
|
Unmodified
|
Documents without any modifications
|
|
1 modification(s) – 5 modification(s)
|
Document modification counts (from 1 up to 5 modifications)
|
|
Avg./doc. user/editor
|
Average time per document in user/editor mode
|
|
Avg./doc. user/operator
|
Average time per document in user/operator mode
|
|
Avg./doc. both editor/operator modes
|
Average time per document in both editor/operator modes
|
|
Avg./page user/editor
|
Average user/editor time per page
|
|
Avg./page user/operator
|
Average user/operator time per page
|
|
Avg./page both editor/operator modes
|
Average time per page in both editor/operator modes
|
|
Avg./user user/editor
|
Average documents handled per user/editor
|
|
Avg./user user/operator
|
Average documents handled per user/operator
|
|
Avg./user both editor/operator modes
|
Average per user in both editor/operator modes
|
|
No. times exported
|
Export occurrences
|
|
No. documents exported
|
Number of exported documents
|
|
Avg. export/doc
|
Average export time per document
|
|
Total export time
|
Aggregate export time
|
|
Avg. export/doc (errors)
|
Average export time per document (with errors)
|
|
Total export time (errors)
|
Total export time (with errors)
|
|
(AI) Total requests
|
Total AI requests sent
|
|
(AI) Requests OK / KO
|
Successful / failed AI requests
|
|
(AI) Total AI request time
|
Total duration of AI requests
|
|
(AI) AI Docs (requests)
|
Number of documents with AI processing
|
|
(AI) Avg. AI request time per doc
|
Average AI request time per document
|
Batch-Level Report
Description:
Displays detailed metrics for each batch, including creation date, processing and export data, and errors. This is a subreport shown when a specific job is selected.
Columns:
|
Field
|
Description
|
|
Job
|
Name of the job/project
|
|
Batch
|
Batch identifier
|
|
Created
|
Batch creation date/time
|
|
Docs.
|
Number of documents in batch
|
|
Pages
|
Total number of pages in batch
|
|
Errors
|
Processing errors during batch execution
|
|
Validated only by system
|
Documents validated only by system
|
|
Validated by user & system
|
Documents validated by both user and system
|
|
Document types
|
Types of documents in the batch
|
|
№ docs. imported from Hotfolder
|
Imported from Hotfolder
|
|
№ docs. imported from IMAP
|
Imported from IMAP
|
|
AVG imported/docs Hotfolder/IMAP
|
Average per-document import from Hotfolder/IMAP
|
|
AVG imported/pages Hotfolder/IMAP
|
Average per-page import from Hotfolder/IMAP
|
|
Processing server
|
Server handling batch processing
|
|
№ docs. processed by system
|
Documents processed automatically by the system
|
|
№ times processed
|
Number of processing runs per batch
|
|
Total processing time (system)
|
Total processing duration (system)
|
|
Avg./doc. processed by system
|
Average system processing time per document
|
|
Total reprocessing time (user)
|
User reprocessing time
|
|
Avg./doc. reprocessed by user
|
Avg. user reprocessing time per document
|
|
Unmodified
|
Unmodified documents
|
|
1 modification(s) – 5 modification(s)
|
Number of documents with (1–5) edits
|
|
Avg./doc. user/editor
|
User/editor average document time
|
|
Avg./doc. user/operator
|
User/operator average document time
|
|
Avg./doc. both editor/operator modes
|
Both modes (average per document)
|
|
Avg./page user/editor
|
User/editor average time per page
|
|
Avg./page user/operator
|
User/operator average time per page
|
|
Avg./page both editor/operator modes
|
Both modes (average per page)
|
|
Avg./user user/editor
|
User/editor average per user
|
|
Avg./user user/operator
|
User/operator average per user
|
|
Avg./user both editor/operator modes
|
Both modes (average per user)
|
|
Export server
|
Server responsible for export
|
|
No. times exported
|
Export occurrences
|
|
No. documents exported
|
Exported documents count
|
|
Avg. export/doc
|
Average export time per document
|
|
Total export time
|
Total export time
|
|
Avg. export/doc (errors)
|
Average export time per doc (with errors)
|
|
Total export time (errors)
|
Total export time with errors
|
|
(AI) Total requests
|
Total AI requests
|
|
(AI) Requests OK / KO
|
Successful/failed AI requests
|
|
(AI) Total AI request time
|
Aggregate AI processing time
|
|
(AI) AI Docs (requests)
|
Number of documents with AI requests
|
|
(AI) Avg. AI request time per doc
|
Average AI processing time per document
|
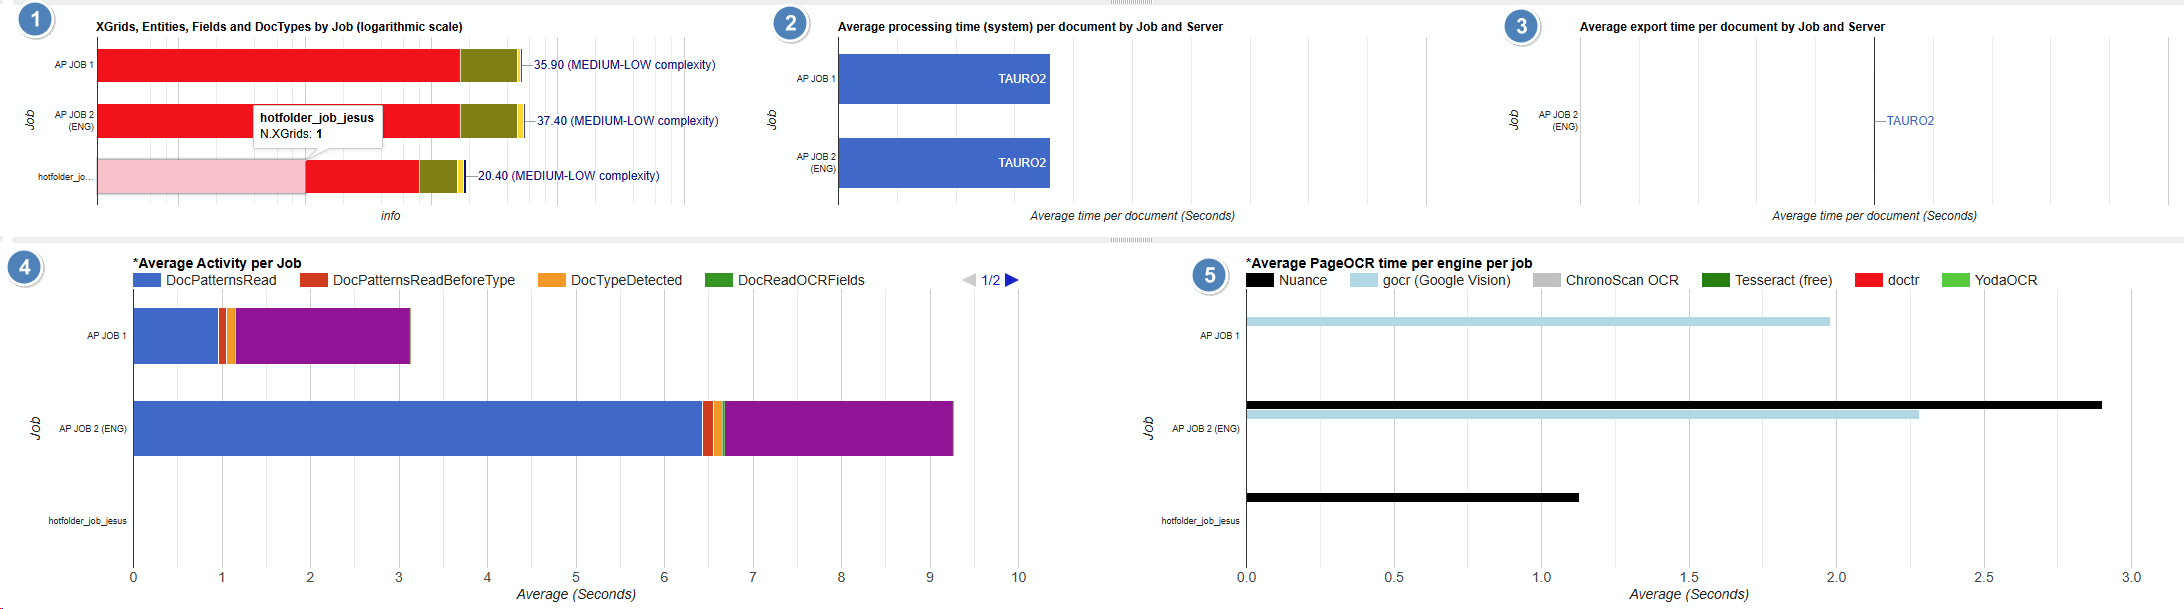
# Graphs Overview
1. XGrids, Entities, Fields, and DocTypes by Job (logarithmic scale)
Description: Measures the complexity level of each job by calculating a logarithmic metric based on:
-
Number of XGrids (data grids)
-
Number of Entities, recognized Fields, and Document Types
Interpretation:
-
Longer bars = Higher job complexity
-
Logarithmic scale enhances readability for wide numeric ranges
-
Automatic text labels (e.g., "MEDIUM-HIGH complexity") aid comparison
2. Average System Processing Time per Document by Job and Server
Description:
Displays the mean automated processing time (in seconds) per document, segmented by job and processing server.
Interpretation:
-
Visualizes efficiency and workload per job and per engine
-
Useful for bottleneck detection and server balancing
3. Average Export Time per Document by Job and Server
Description:
Illustrates the average export duration (in seconds) per document, for each job and export server.
Interpretation:
-
Identifies slow jobs or servers in post-processing/export phase
-
Key performance indicator for workflow optimization
4. Average Activity per Job
Description:
Shows average user and system activity time (in seconds) per job, across the document lifecycle.
Interpretation:
-
Longer bars = More interaction/processing per job
-
Useful for spotting resource-intensive projects
5. Average PageOCR Time per Engine per Job
Description:
Displays average OCR processing time per page, segregated by OCR engine and job.
Interpretation:
-
Spots which jobs/engines are most or least efficient
-
Highlights opportunity for OCR process optimization
# Toolbar
|
#
|
Button
|
Description
|
|
1
|
Refresh / Graphs Selector
|
Filters view to show all data or only highlighted graphs
|
|
2
|
View Manager
|
Save, load, or delete sets of filters/views
|
|
3
|
Generate Report (.xls)
|
Export currently generated data to Excel (must generate report first)
|
|
4
|
Explore
|
Opens file explorer for browsing saved reports
|
|
5
|
Seconds / Minutes
|
Choose time unit for report display
|
|
6
|
Submit
|
Generate or update report using selected filters/options
|
|
7
|
[SQL]
|
(Admin/Debug only): Show or copy the query (SQL) used for the report
|
|
8
|
Configure Report
|
Advanced configuration for report fields and columns (choose which to display). See "*Column Selection" below
|
|
9
|
Breakdown Period (Compare)
|
Splits results by individual time periods, for comparison. See "*Breakdown Period (Compare mode)" below
|
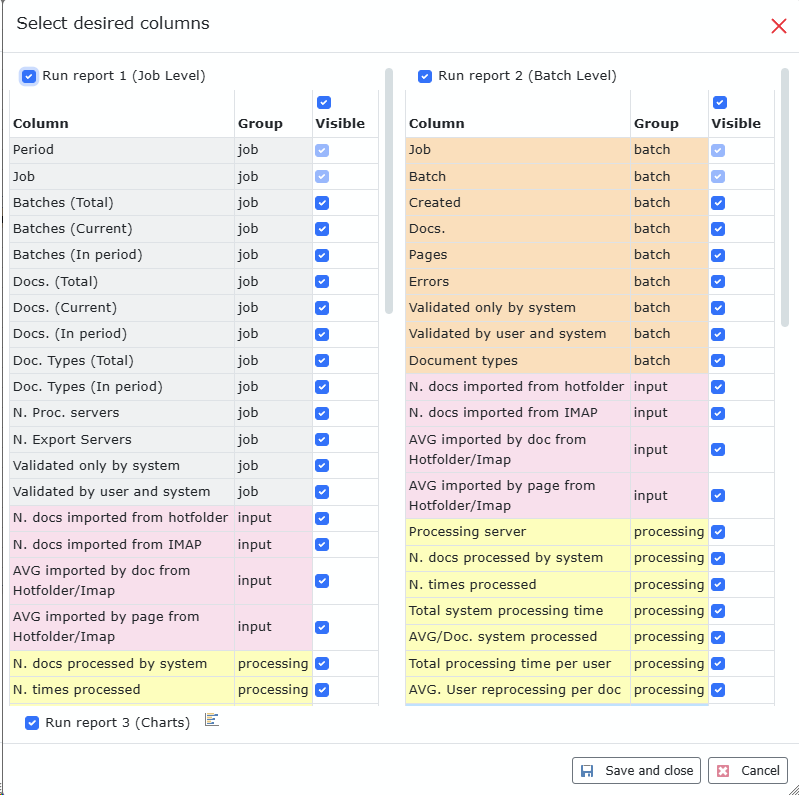
*Column Selection and Report Activation
The column selector dialog (as shown in the image) allows you to fully customize which reports are generated and which columns are visible in each report.
Report Activation
-
Checkboxes at the top ("Run report 1", "Run report 2", "Run report 3") allow you to enable or disable each of the main reports:
-
Run report 1 (Job Level): Activates the job-level report.
-
Run report 2 (Batch Level): Activates the batch-level report. Note: Report 2 requires that Report 1 is active. If you want to view batch-level data, you must have job-level data enabled first.
-
Run report 3 (Charts): Activates the charts section.
Column Visibility
-
Each report (Job Level, Batch Level) lists all available columns on the left, grouped by their data stage or type (e.g. "input", "processing", "batch").
-
The "Visible" checkbox for every column determines whether that column will be shown when the report is generated.
-
You can freely select or deselect columns, customizing the table to show only the information you require.
Saving and Applying Configuration
-
To apply your changes, you must save your selection as a view by clicking "Save and close".
-
Only after saving and selecting the view will your column choices and the active reports be reflected in the generated output.
Summary Table
|
Item
|
Behavior
|
|
Report Activation
|
Enable/disable Job, Batch, or Chart reports using the checkboxes at the top.
|
|
Batch Level Requires Job
|
The Batch Level report (Report 2) can only run if the Job Level report (Report 1) is also enabled.
|
|
Column Visibility
|
Show or hide columns for each report using the visibility checkboxes.
|
|
Saving Changes
|
Changes must be saved as a view to be applied. Use "Save and close".
|
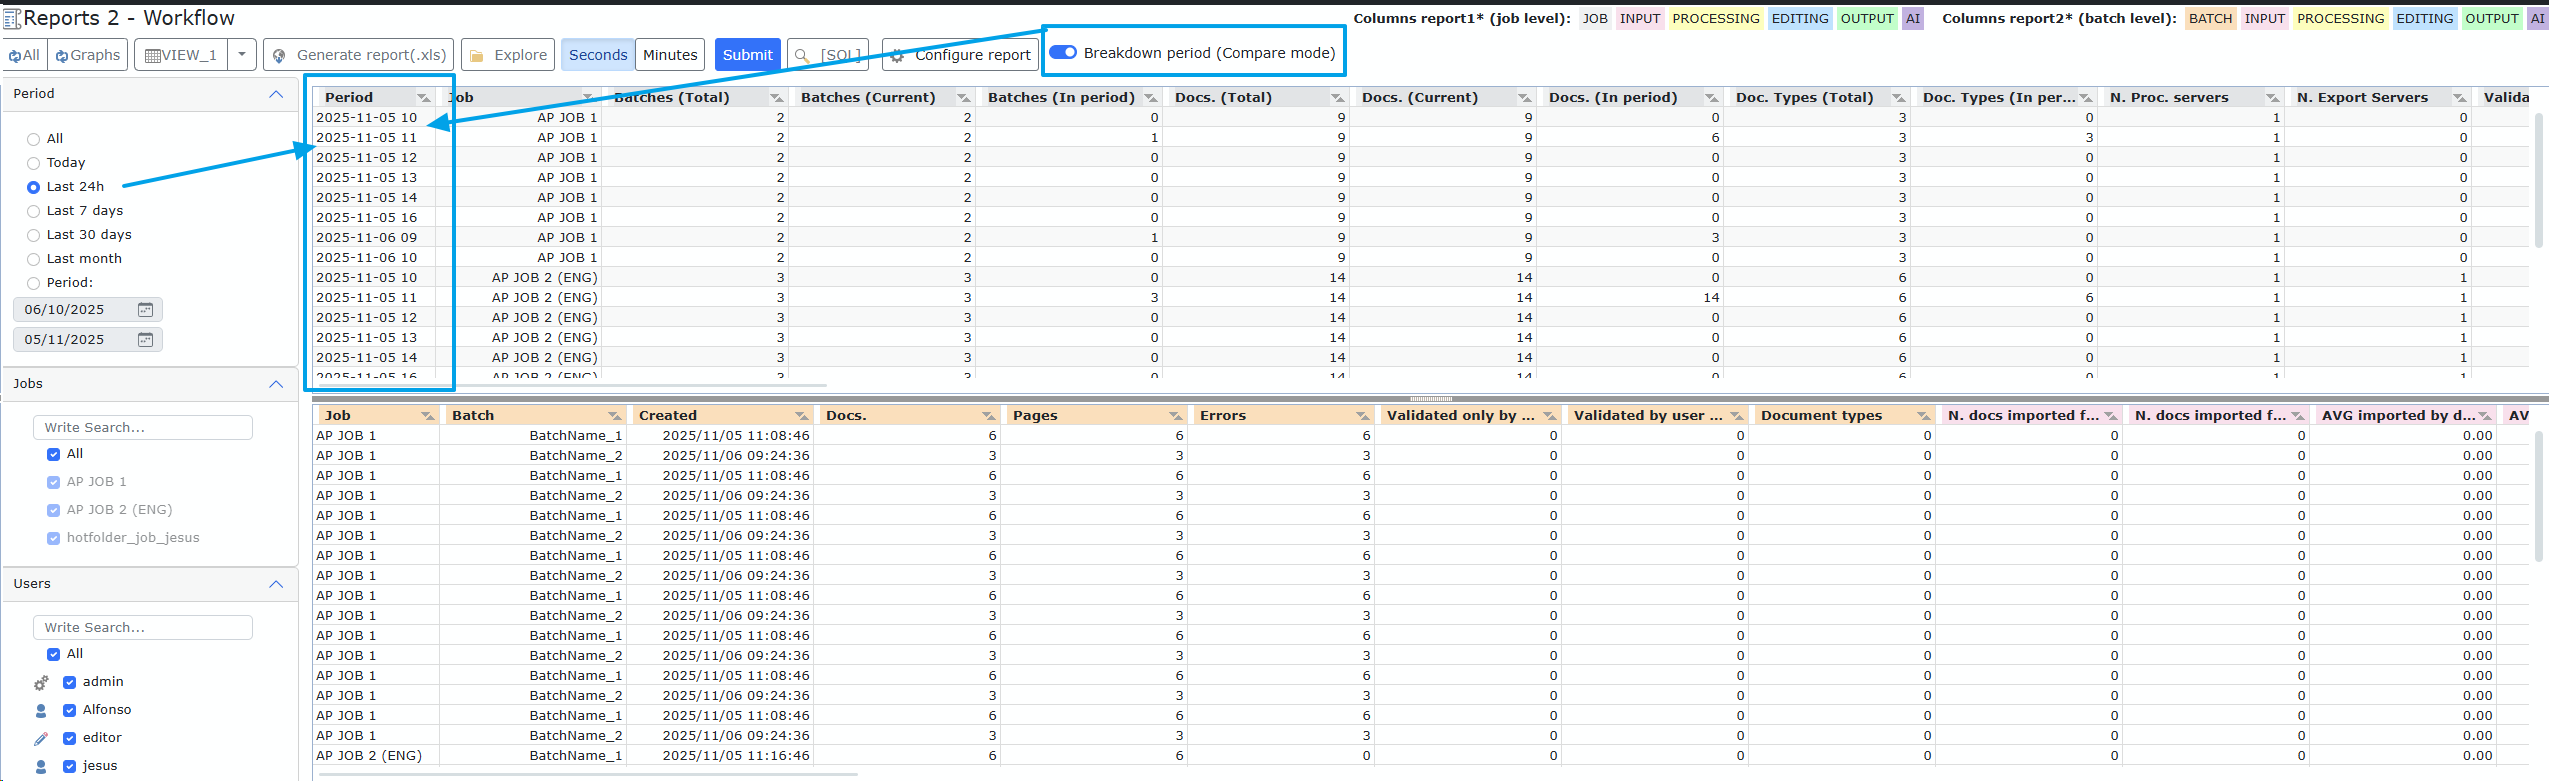
*Breakdown Period (Compare mode)
The Breakdown period (Compare mode) option, located in the toolbar, allows you to split (break down) your report results by individual time periods within your selected date range. When you enable this mode:
-
A new Period column is added to your report tables.
-
The Period column shows data grouped by each sub-period (such as hour, day, week, or month) inside the date range you selected with the filters.
How It Works
1. Select a date range or period filter on the left (e.g., "Today", "Last 7 days", or a custom range).
2. Enable the Breakdown period (Compare mode) option in the toolbar.
3. When you run (submit) the report, the system will automatically split your results by sub-periods (for example, by hour if “Last 24h” is selected, or by day if a multi-day range is selected).
4. The resulting tables will display a Period column, making it clear to which sub-period each row's data belongs.
Example: If you filter for "Last 24h", your report results will be broken down by hour (see blue highlights/arrows in the screenshot). If you filter for "Last 7 days", the breakdown will be by day.
Key Points
|
#
|
Function
|
Description
|
|
1
|
Add Period Column
|
Adds a "Period" column that groups results by each sub-period within your selected date range.
|
|
2
|
Compare Over Time
|
Spot changes, trends, or patterns between different intervals.
|
|
3
|
Re-run Report Required
|
Click Submit to regenerate the report with the period breakdown applied.
|
| |
# Applicable Filters
|
#
|
Filter
|
Description
|
|
1
|
Period/Date
|
Select a specific date range or period to filter report results
|
|
2
|
Job
|
Filter data by selected jobs
|
|
3
|
User
|
Limit the report to show data for selected users
|